
The Visibility Gap
Here’s a scenario that plays out daily: A customer calls asking where their shipment is. The sales team checks the ERP — it says “shipped.” They call the warehouse — it left 3 days ago. They call the carrier — it’s stuck at customs. Nobody knew until the customer called.
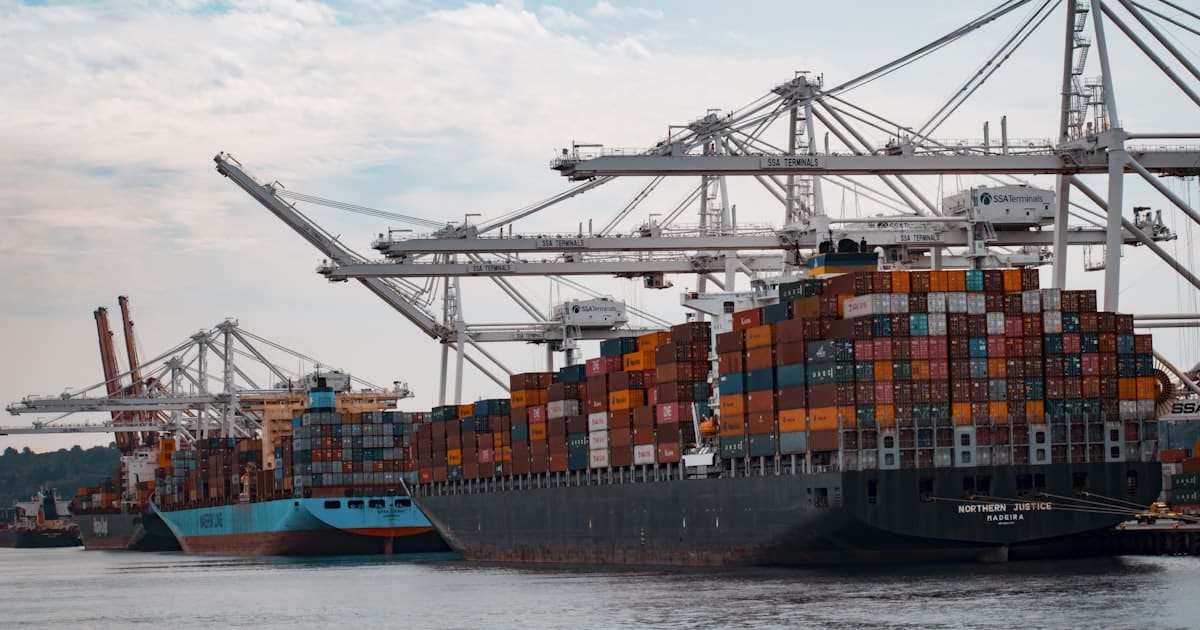
That’s the visibility gap. Your data exists in silos: ERP, WMS, TMS, carrier portals, and spreadsheets. A supply chain control tower connects them into a single real-time view.
Control Tower Architecture
A supply chain control tower has four layers:
- Data ingestion: APIs, EDI, file imports, and IoT feeds from all supply chain partners
- Data harmonization: Normalize different data formats into a common model (shipment → milestones → events)
- Intelligence layer: ETA predictions, exception detection, risk scoring
- Presentation: Dashboards, alerts, and collaborative workflows
The Data Model
The core data model that we’ve found works across industries:
- Order: What was ordered, by whom, when expected
- Shipment: The physical movement unit (one order can have multiple shipments)
- Milestone: Expected events (pickup, departure, customs, arrival, delivery)
- Event: Actual events — timestamped, geotagged, with status codes
- Exception: When actual deviates from expected beyond a threshold
The magic happens in the gap between milestones and events. When an expected milestone doesn’t happen within its time window, that’s an exception — and exceptions drive action.
Integration Patterns
The hardest part isn’t the technology — it’s getting data from 20+ partners who all speak different languages:
- Tier 1 carriers (FedEx, DHL, Maersk): REST APIs with webhook callbacks
- Regional carriers: SFTP file drops, sometimes email with Excel attachments
- Warehouses: EDI 214/990 messages or custom WMS APIs
- IoT devices: MQTT streams for temperature, location, vibration
- Manual updates: Mobile app for field agents, WhatsApp chatbot for drivers
ETA Prediction
Static ETAs (“5–7 business days”) are useless. Dynamic ETA models consider:
- Historical transit times for the same lane
- Current carrier performance (are they running ahead or behind?)
- Known disruptions (port congestion, weather, strikes)
- Day-of-week and seasonal patterns
A well-trained model predicts delivery dates with ±1 day accuracy 85% of the time — dramatically better than static estimates.
Need visibility across your supply chain? Let’s map your data sources and design a control tower.